
Visibility. Explanation. Action.
The data layer for future-ready renter operations. Every signal that drives occupancy, conversion, and NOI, surfaced, explained, and ready to act on.
Schedule A Demo






Every signal. One executive view.
Occupancy, availability, conversion, and exposure in one place. See what’s gaining momentum, where risk is building, and which communities need attention first.
Connect supply, demand, and conversion.
See how available inventory, leasing velocity, and lead-to-lease performance are moving across the portfolio.
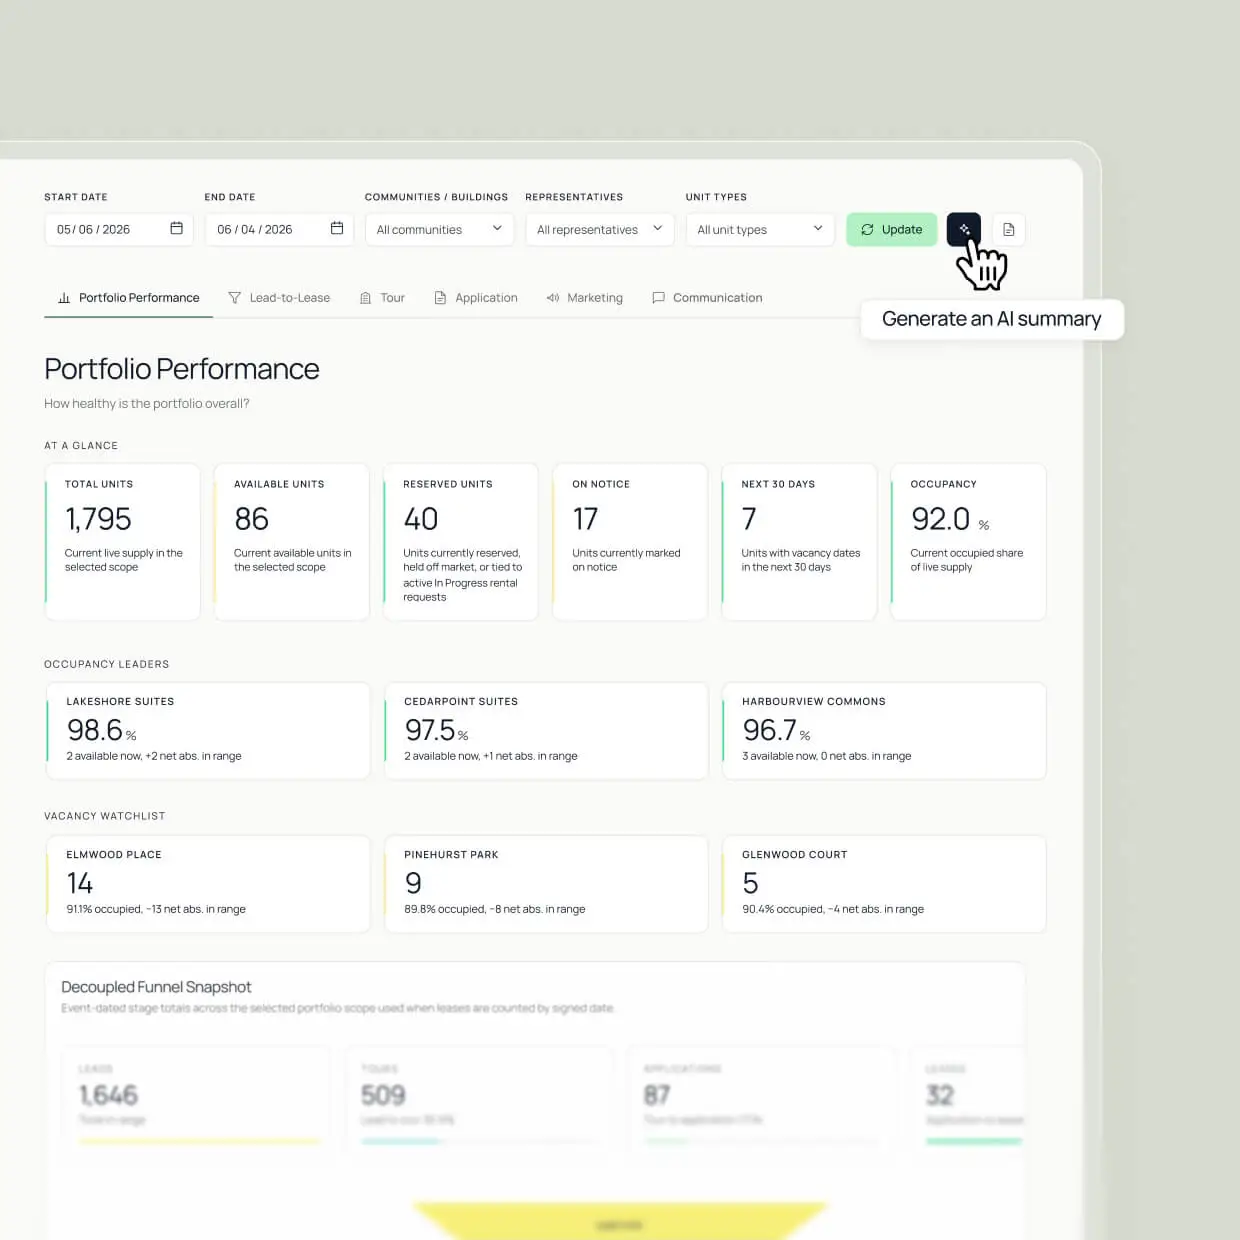
Catch exposure before it hits NOI.
Spot communities with rising availability, slower movement, or weaker conversion before they become revenue problems.
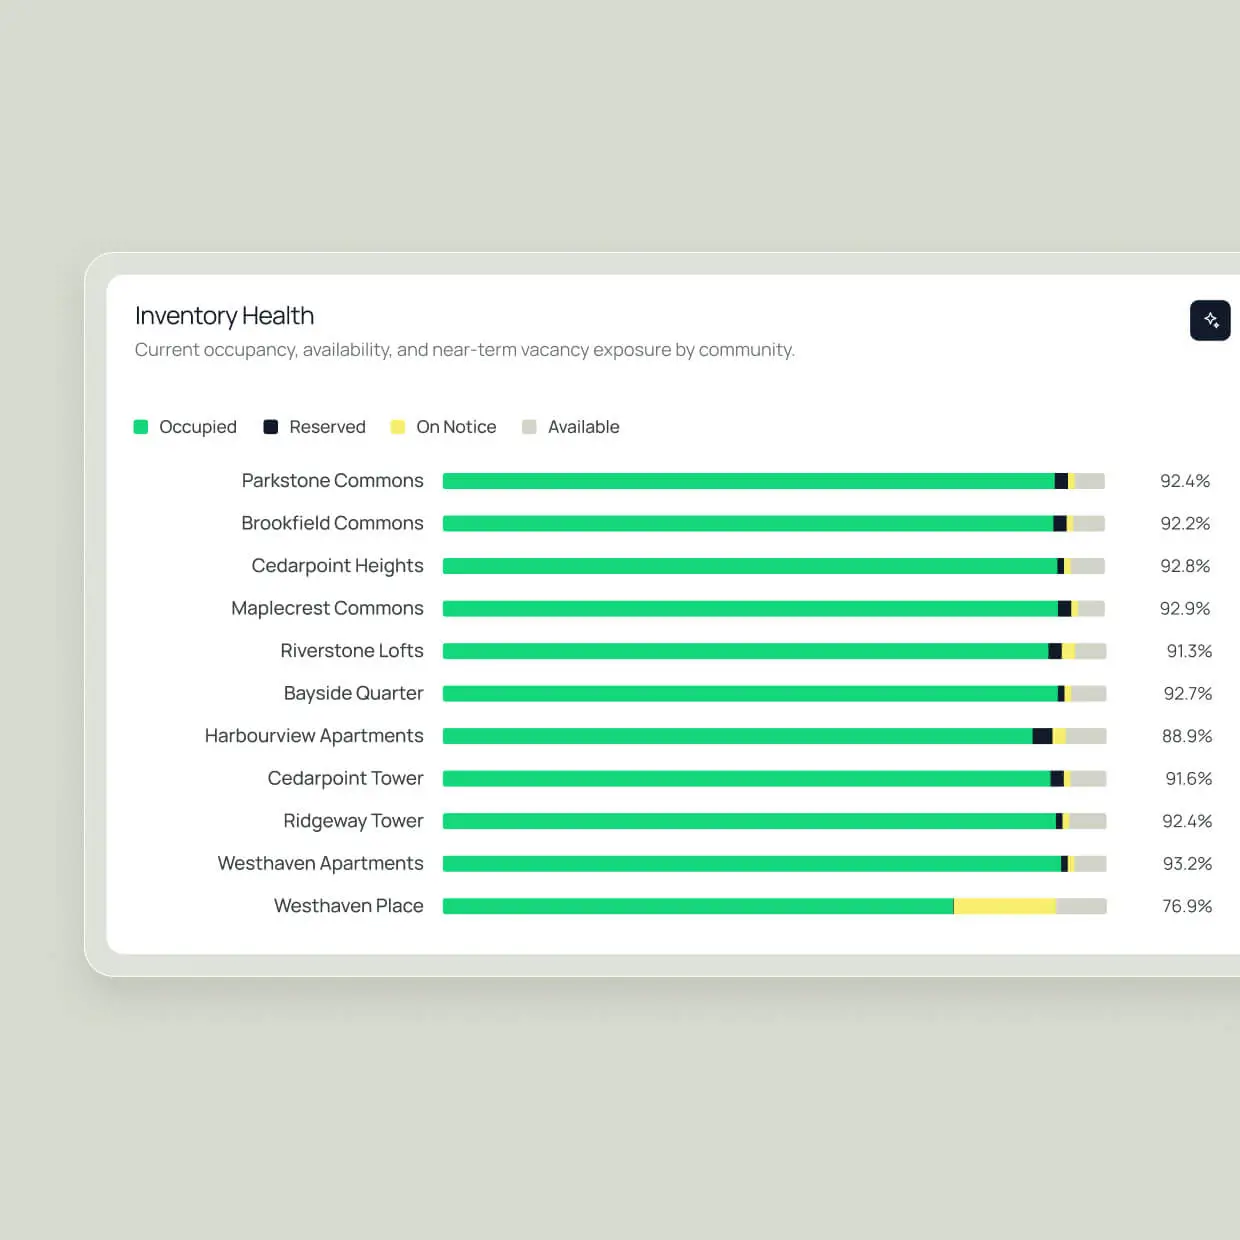
Know where to focus next.
Shift spend, review pricing, adjust promotions, or direct support to communities that need it most.
.webp)
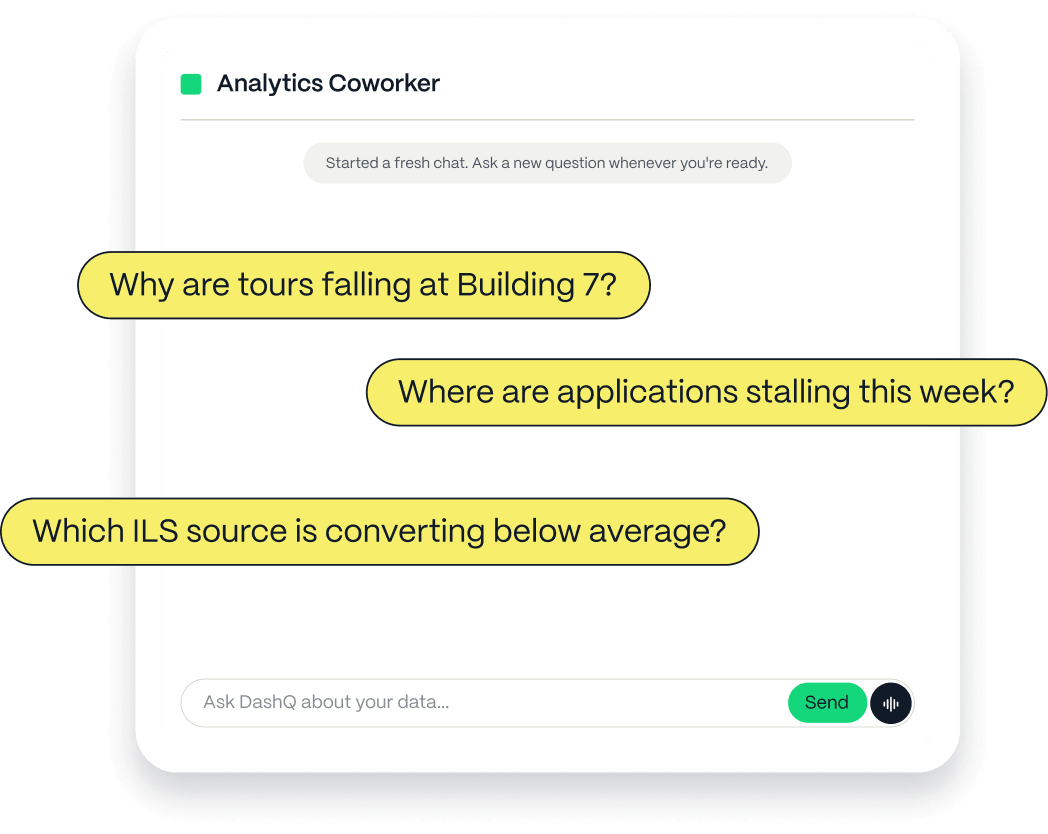
AI ANALYTICS COWORKER
Answers that used to need an analytics team.
Ask in plain English and get the analysis built on the spot. Keep digging with follow-up questions and save the view your team needs again.
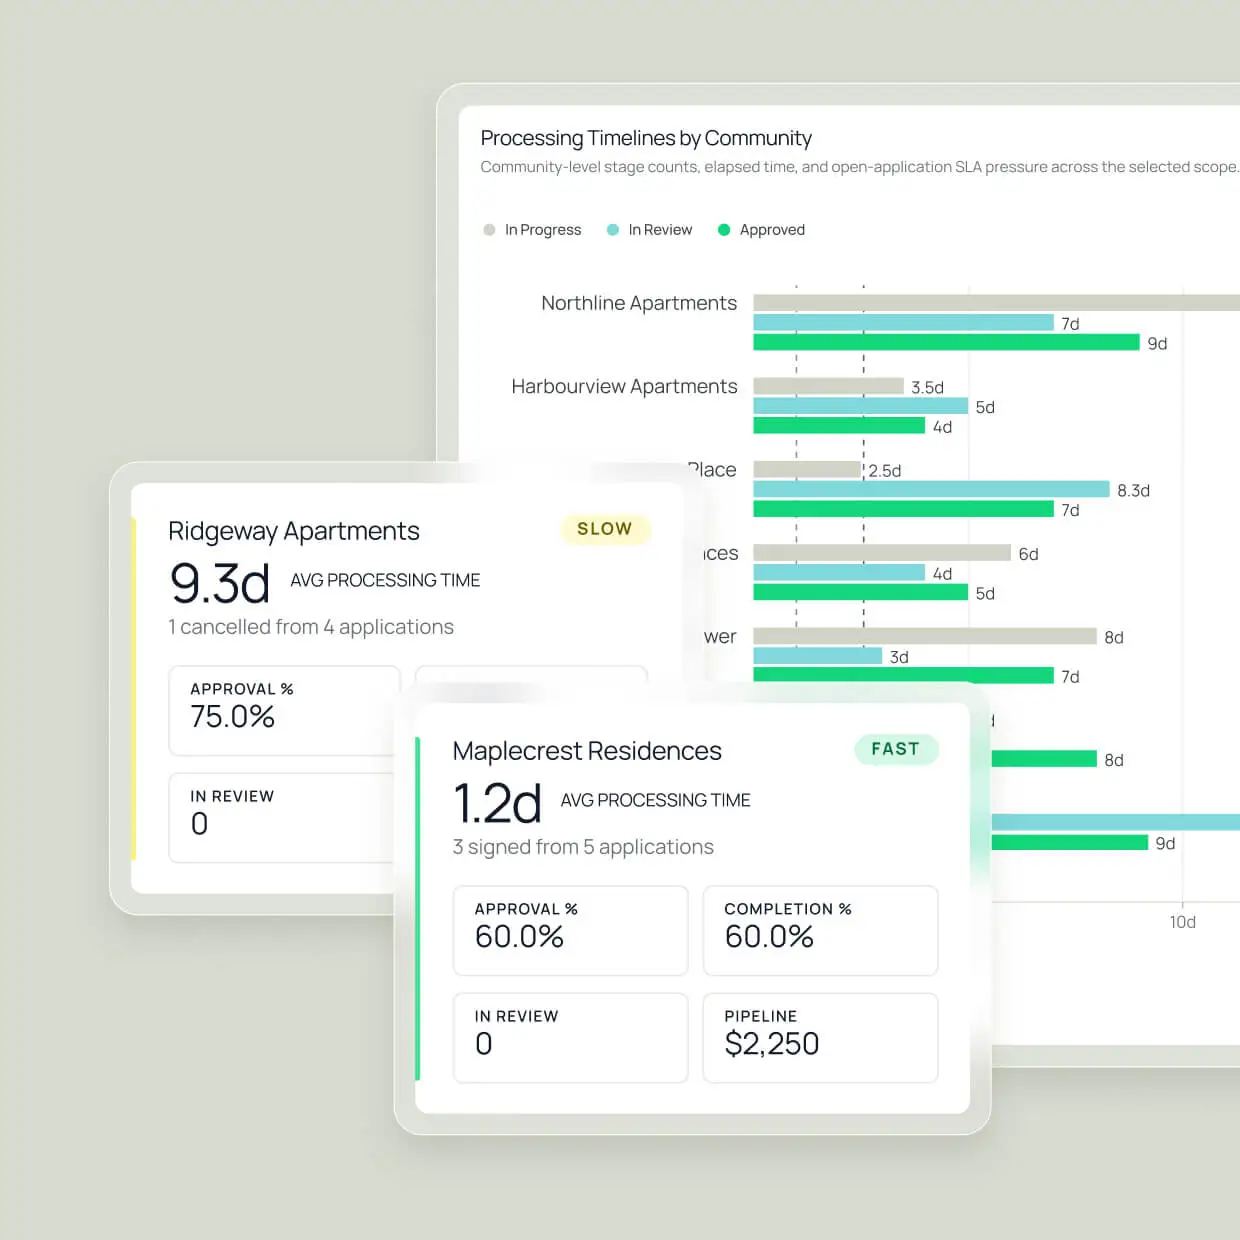
Leasing momentum, traced through every stage.
Track each stage from inquiry to signed lease. Filter performance by community, unit type, agent, and time period to find where prospects move forward, slow down, or drop off.
Find the drop-offs costing you leases.


See which tours move prospects forward.
Keep ready renters moving.
The teams turning insight into transformation.

DashQ is making our leasing process easier, quicker and more secure.


Faster leasing, smoother coordination, better experience for all.


With DashQ, Luxo accelerated stabilization and built a high-performance leasing culture.

Lead sources, measured by leasing outcomes.
Lower cost per lease by backing the sources that turn leads into tours, applications, and signed leases, not the ones that only fill the funnel.
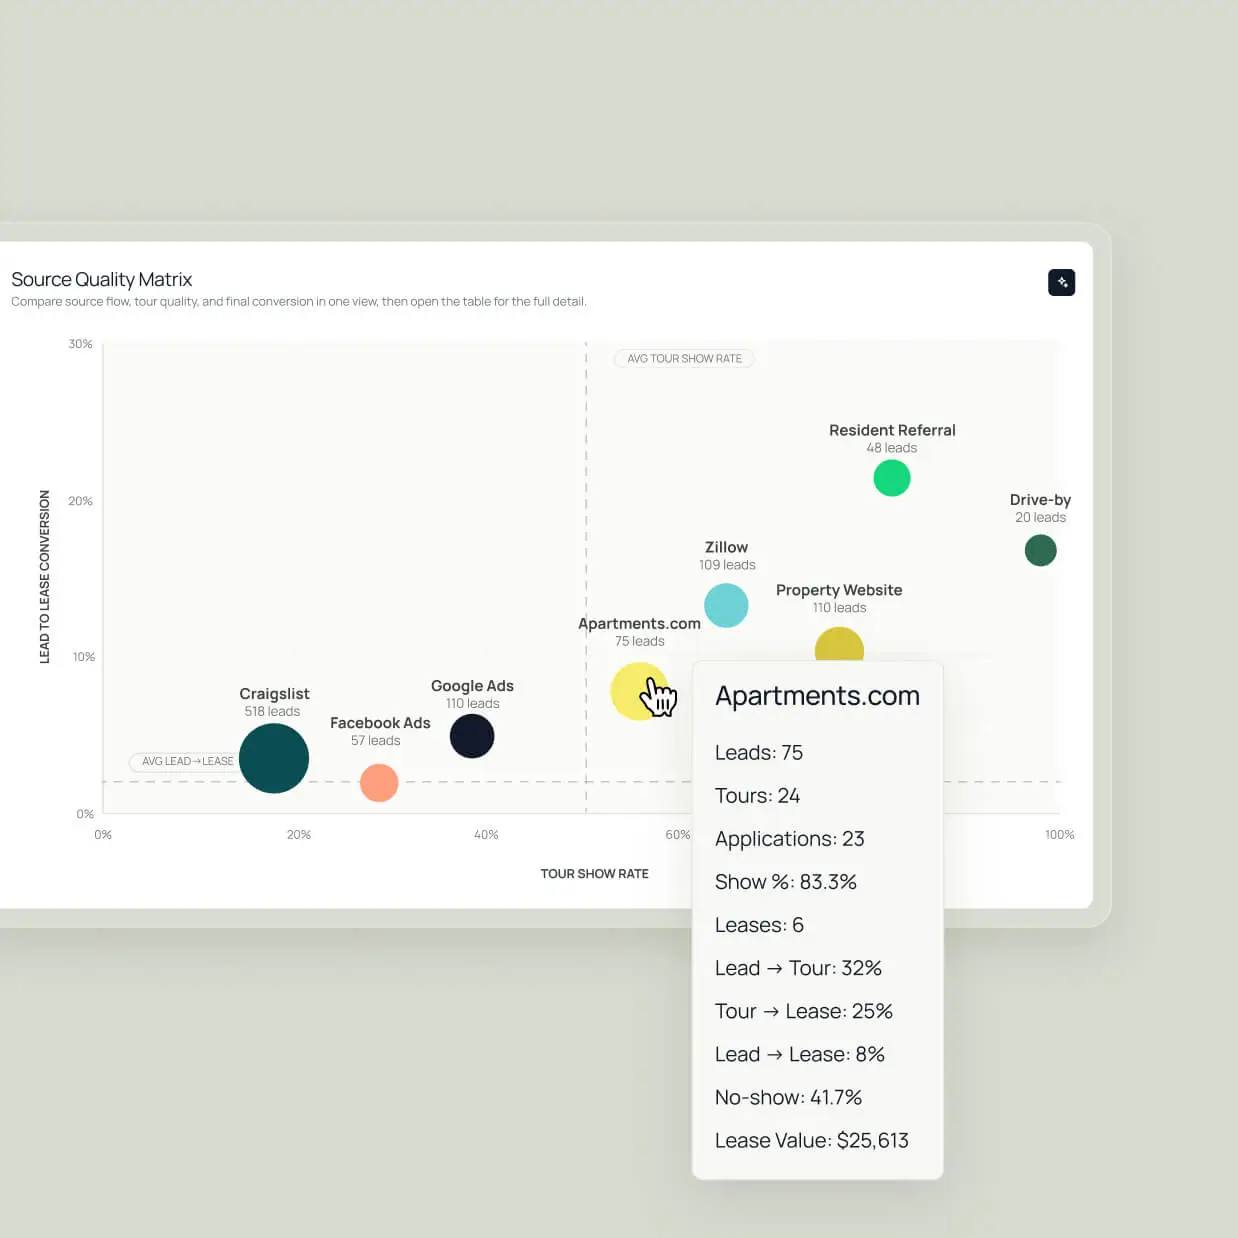
Put budget behind what converts
Know which sources deserve more spend, which ones need a closer look, and which ones are creating activity without enough return.
.webp)
Separate source quality from funnel friction
See whether the issue is source, follow-up, tour experience, or application flow before shifting spend or cutting the channel.
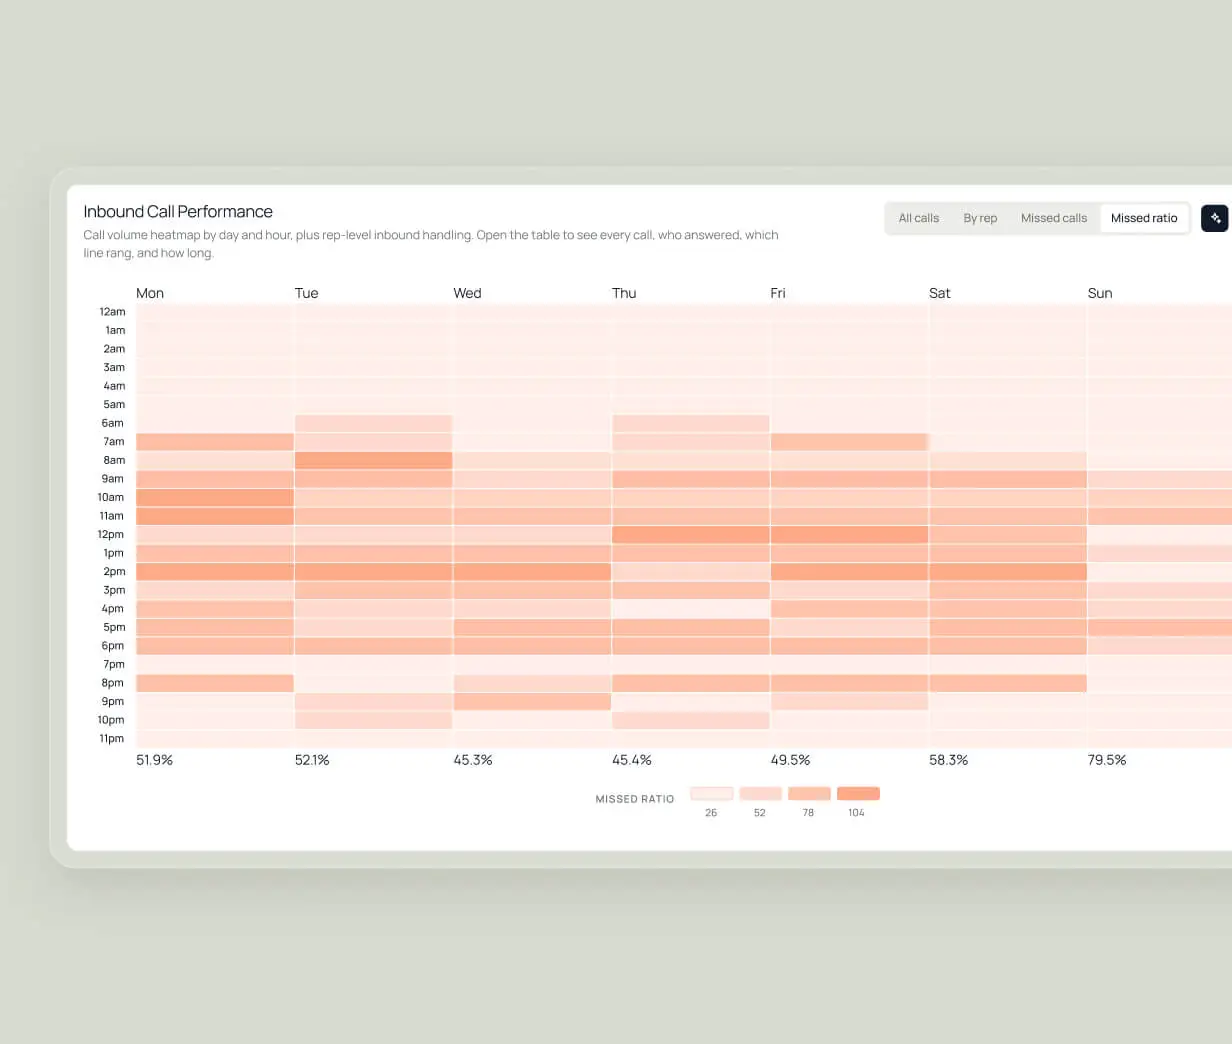
Inbound demand. Outbound follow-up.
Track inbound activity and outbound follow-up across calls, texts, emails, chats, and AI conversations. Know where prospects are moving and where effort needs attention.
Handle inbound demand well
Track inbound call volume, human first response time, representative follow-up, and channel mix to see how quickly and consistently renter interest gets a human response.
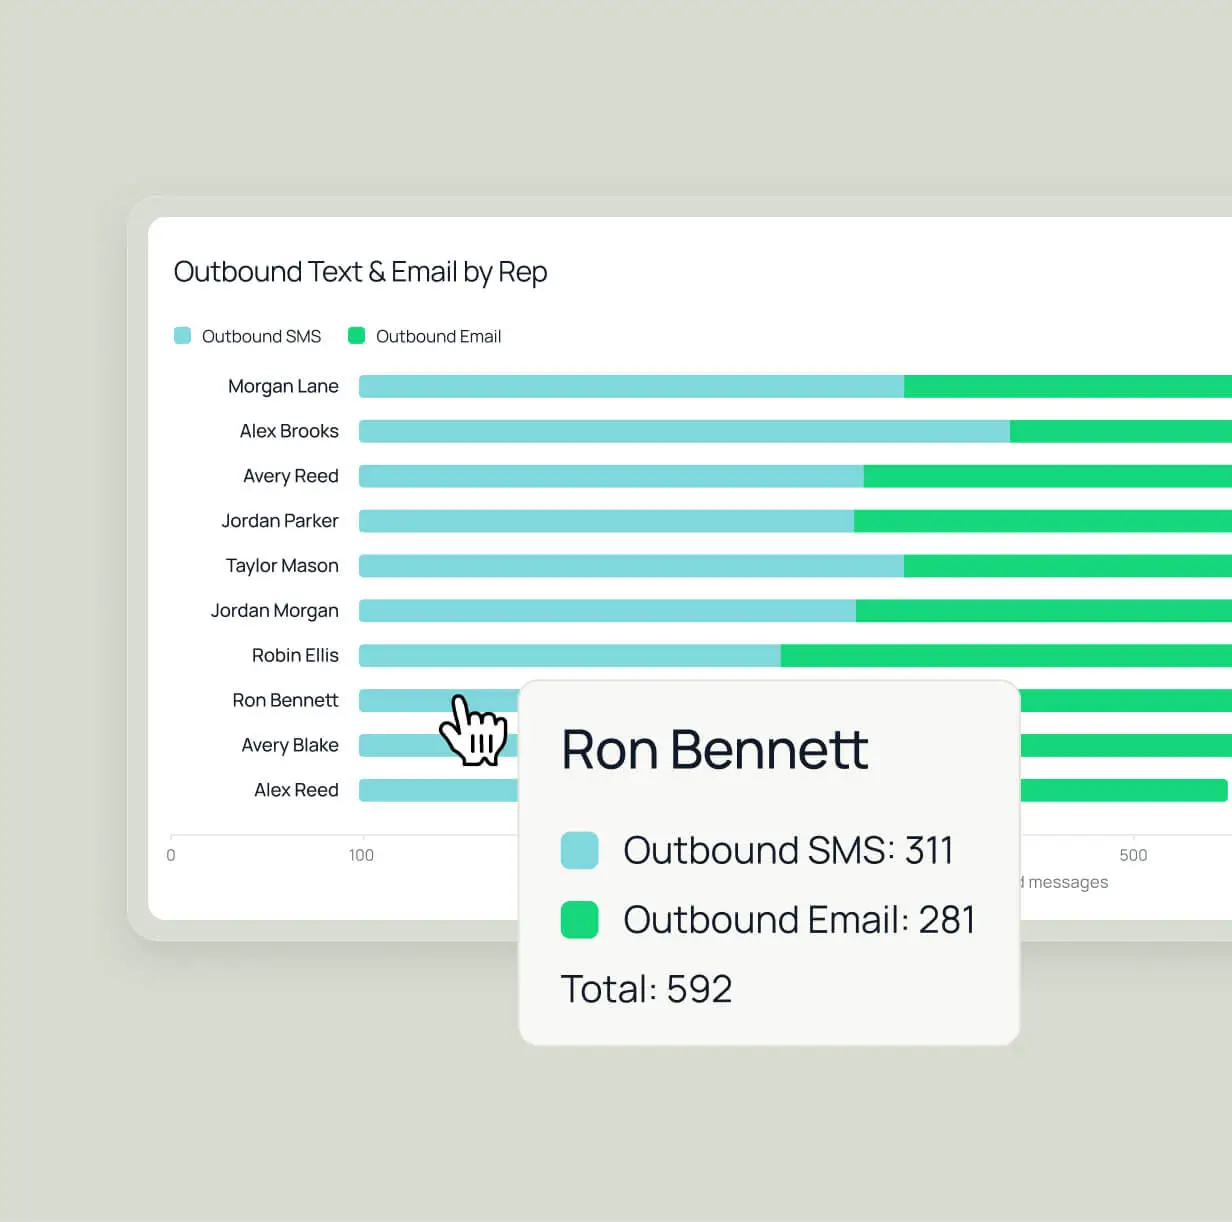
Make follow-ups visible
See outbound calls, talk-time coverage, and daily SMS and email usage by reps to understand who is actively moving prospects forward.
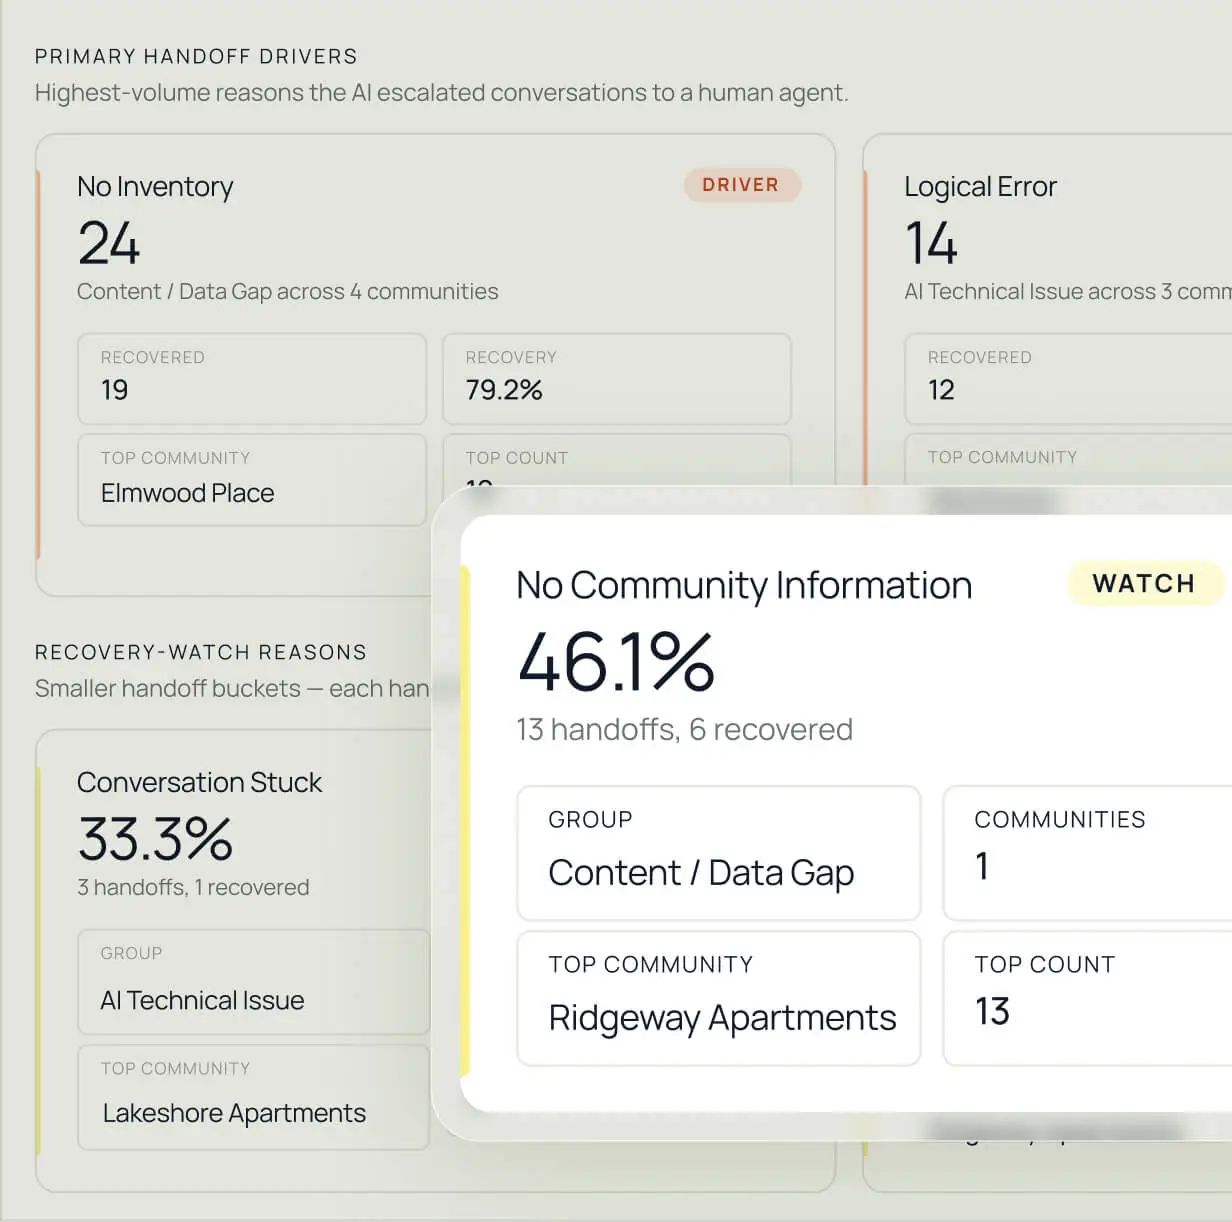
Know where your VLA needs support.
Track AI-managed leads, tours, leases, and handoffs to see where your VLA is converting well and where your team, inventory, availability, or knowledge base needs attention.
See clearer. Operate smarter. Grow with more confidence.
Explore our other products


Join our community and get multifamily tips & trends delivered to your inbox.